
The power behind successful projects
Scheduling software designed for construction industry
What is Powerproject?
Powerproject was designed to support the way construction planners work. It has evolved over many years with input from our users to meet the requirements of the industry.
Easy-to-use, yet extremely powerful, it is the software of choice for thousands of construction professionals throughout the World.
Powerproject helps to build the World
Powerproject has been used on some of the world’s most complex construction projects including:
Europe’s highest building – The Shard
The Reichstag in Berlin
Banora Point Highway in Australia
Durban International Airport
The rebuilding of Christchurch New Zealand
II metro line in Warsaw
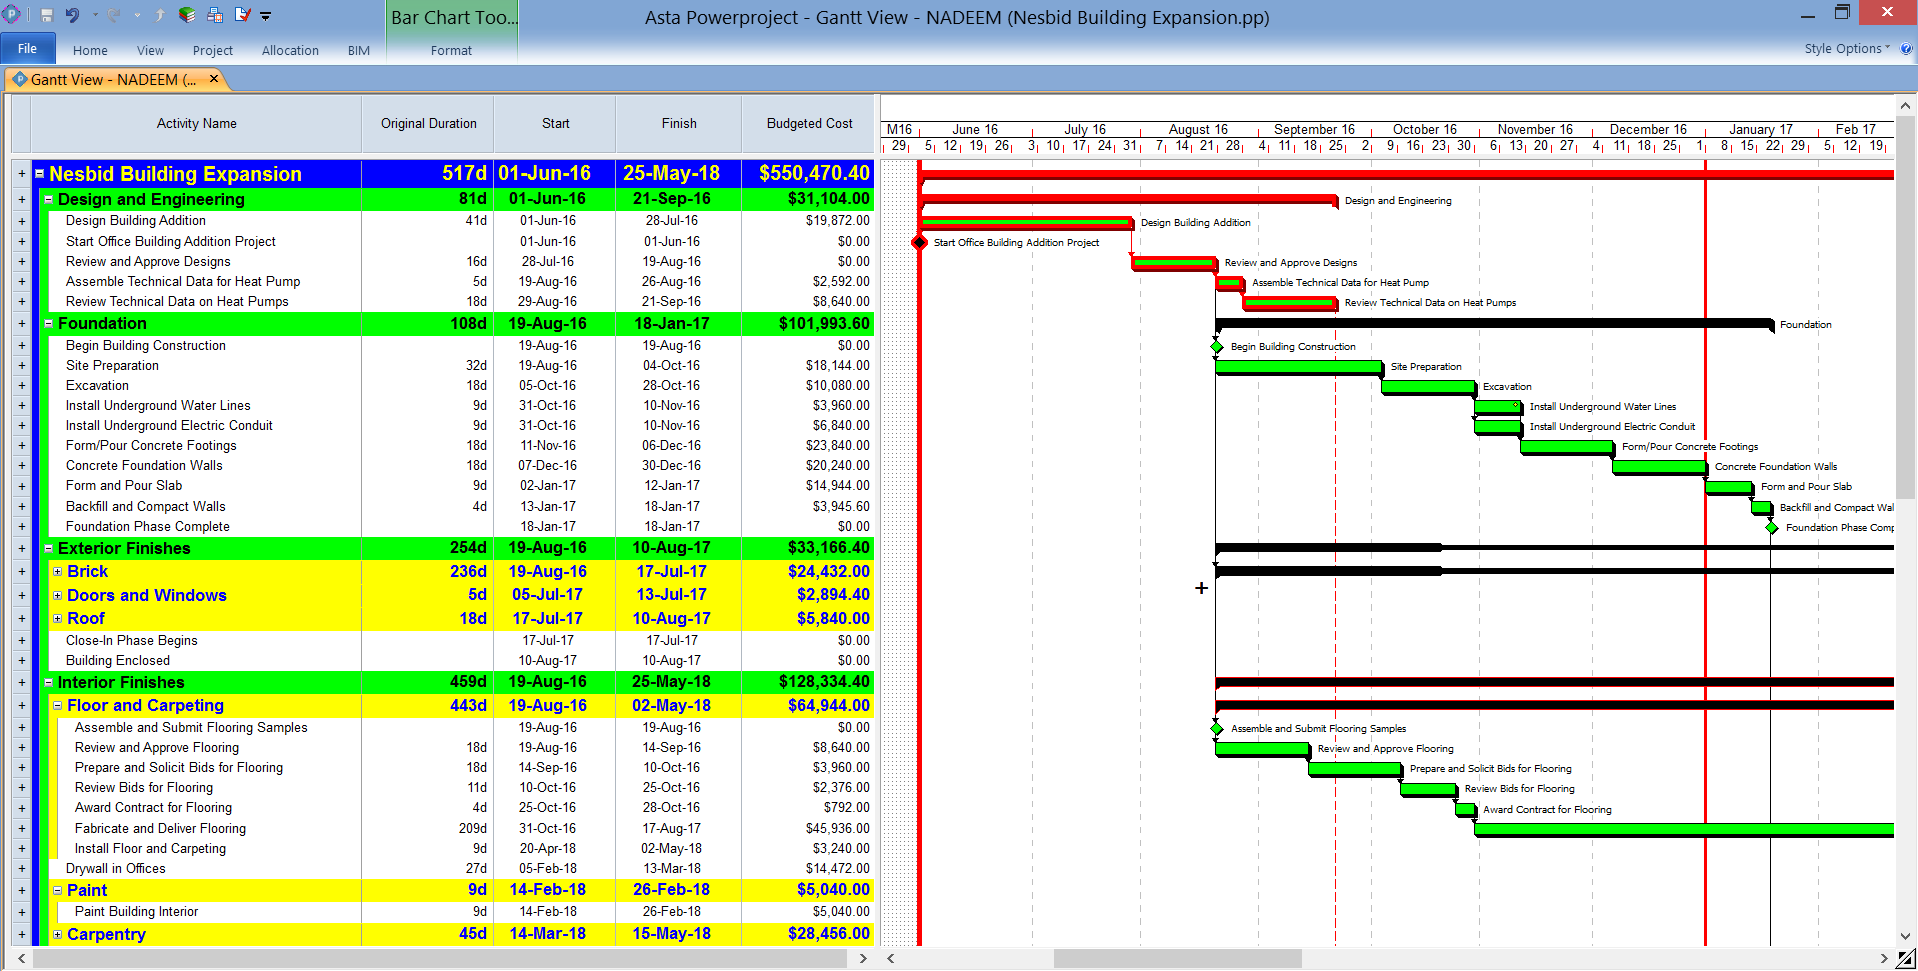
What you already know
Intuitive
Intuitive interface


Clear
Filtering subcontractors
When a project is complex, it may have many subcontractors, thus it is easy to get confused. You can divide your project to smaller parts filtering information about subcontractors.
Calendars adjusted to your company
Are there people in your team, whose work calendars differ in terms of holidays in comparison with abroad contracts? Assign proper types of calendars to activities or resources or create your own calendars and let Powerproject calculate necessary durations and dates.
Fluent perspective
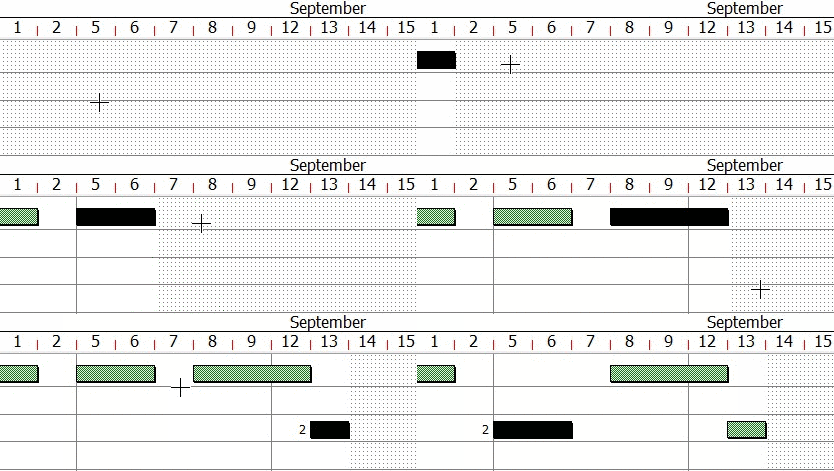
Duration of the project or currently required level of detail determine the perspective. You can change the timescale of the whole project within seconds.
Clear preview
Link activities and organize them into summary tasks – transparent plan and preview give you a full scope of your project, which means meximum information within minimum amount of time.
Actual dates
Enter actual dates not just percent completes. Have a preview of how your action implicate the project.
Eye-friendly Gantt chart
Create your own code library, in order to assign resource, material, cost and risk info to activities. Thanks to drag and drop options, searches and filtering, it is easy to add necessary details to activities.
Visualize
Add photos and pictures to Gantt Chart. One picture can express more than a thousand words.
Professional
What users say about Powerproject?
Project Management in mobile release
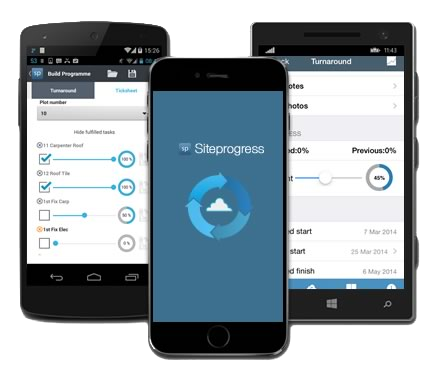
One dimension further
